
Diagnosing performance issues in Java applications often starts with analyzing thread dumps — a notoriously complex and tedious task. ThreadLogic, an open-source tool originally developed by Oracle (formerly part of BEA’s diagnostic toolkit for WebLogic), simplifies this process by offering visual insights and automated detection of threading problems. This guide walks through using ThreadLogic to pinpoint thread pool issues, lock contention, and other concurrency bottlenecks in Java applications.
Getting Started with ThreadLogic
1. Download the Tool
While Oracle no longer actively maintains a public download link, a trusted GitHub mirror is available:
- Repository: https://github.com/ppoddar/threadlogic
- Latest Release: ThreadLogic.jar
2. Run ThreadLogic
ThreadLogic is a standalone Java Swing app — no installation required.
Just ensure Java 8 or later is installed:
bashCopyEditjava -jar ThreadLogic-2.5.2.jar
What ThreadLogic Does
ThreadLogic reads Java thread dumps and automatically highlights potential issues, making analysis faster and more accurate.

Key Features:
| Capability | Description |
|---|---|
| 🔍 Visual Thread States | Categorizes threads into RUNNABLE, WAITING, BLOCKED, etc. |
| 🚨 Hot Spot Detection | Identifies threads stuck in the same stack frame — potential deadlocks or infinite loops |
| 🔒 Lock Contention Mapping | Shows threads holding or waiting on locks and monitors |
| 🧩 Logical Grouping | Organizes threads by role (e.g., GC, Tomcat, Custom) |
| 📋 Advisory System | Flags issues like TooManyThreads, ThreadSleep, or starvation |
| 💡 Recommendations | Offers remediation advice directly in the interface |
How to Analyze Thread Dumps with ThreadLogic
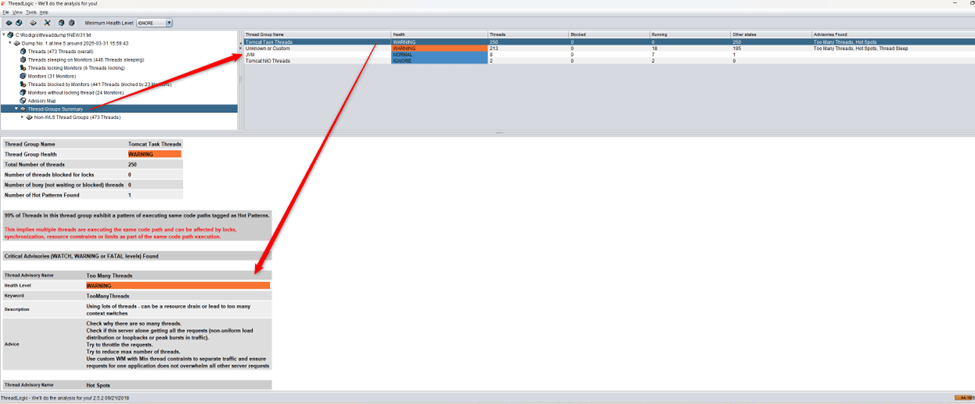
1. Review the Top-Level Summary
ThreadLogic opens with a grouped summary of threads. Key columns include:
- Health: Status based on detected issues
- Blocked / Running: Number of threads in each state
- Advisories Found: Warnings such as TooManyThreads or HotMethodLoop
Example:
| Thread Group | Health | Threads | Blocked | Running | Advisories |
|---|---|---|---|---|---|
| Tomcat Task Threads | WARNING | 250 | 0 | 0 | TooManyThreads |
| GC Threads | NORMAL | 3 | 0 | 1 | None |
| Custom Threads | WARNING | 213 | 0 | 18 | Hot Method Loop |
👉 Look for:
- High counts in
BLOCKED,WAITING, orTIMED_WAITING - Warning signs in the
Advisoriescolumn

2. Dive Into a Thread Group
Click any group to inspect individual threads. For each thread, ThreadLogic shows:
- Name (e.g.,
http-nio-80-exec-47) - State (
TIMED_WAITING,BLOCKED, etc.) - Full stack trace
✅ Watch for:
- Threads stuck on identical stack traces
- Threads blocked on the same monitor (e.g.,
ReentrantLock,ConditionObject)
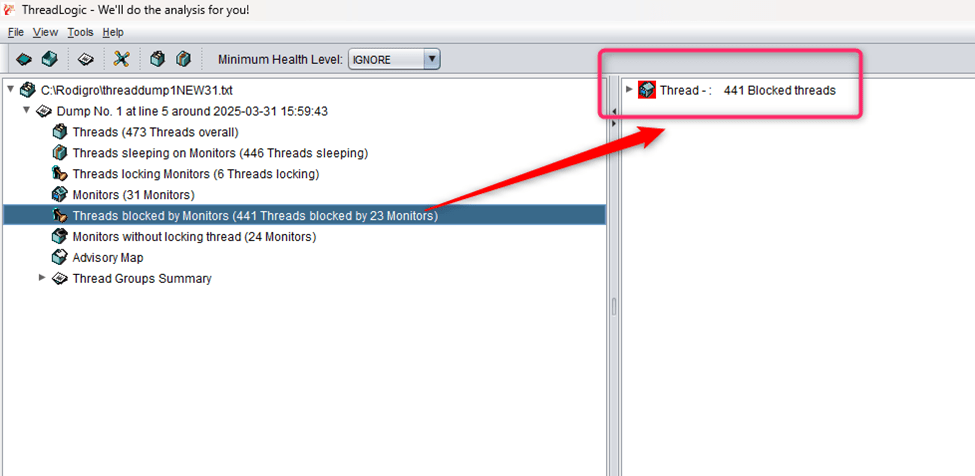

3. Check the Monitor Summary
Go to “Threads Blocked by Monitors” to see objects like <0x0000000102d4bba0>.
✅ Investigate:
- Monitors with a high number of waiting threads
- If the owning thread is missing, make sure future dumps include
PrintConcurrentLocks
4. Read the Advisories Panel
Each advisory includes severity and actionable guidance.
Examples:
| Advisory | Description |
|---|---|
| ❗ TooManyThreads | Likely thread pool misconfiguration or starvation |
| 🔁 HotMethod | Indicates looping or stuck threads |
| ⏱️ ThreadSleep | Potential performance impact from Thread.sleep() |

Case Study: Tomcat Thread Pool Starvation
In a sample thread dump, 441 of 473 total threads were blocked. Notably:
- 248 threads were waiting on a single monitor (
<0x0000000102d4bba0>) - The monitor is a
ConditionObjectfromAbstractQueuedSynchronizer - All threads were parked in the same stack trace:
javaCopyEditat jdk.internal.misc.Unsafe.park(Native Method)
- parking to wait for <0x0000000102d4bba0>
at java.util.concurrent.locks.LockSupport.parkNanos(...)
at java.util.concurrent.locks.AbstractQueuedSynchronizer$ConditionObject.awaitNanos(...)
at java.util.concurrent.LinkedBlockingQueue.poll(...)
Diagnosis:
This is a classic thread pool saturation scenario:
- Threads are waiting for tasks on an empty queue.
- The signal to wake them may never be sent (due to a stuck producer or missed signal).
- The thread holding the lock may not be present in the dump or is blocked itself.
Troubleshooting Steps
- Find the Lock Owner
Look for the thread locking<0x0000000102d4bba0>. If not found, ensure the dump is complete. - Review the Code
Examine usage ofReentrantLock,ConditionObject, orLinkedBlockingQueue. Identify long-running tasks or deadlocks. - Understand Thread States
If threads are parked or waiting indefinitely, it suggests starvation, deadlock, or missed wake-ups.
Conclusion
ThreadLogic simplifies Java thread dump analysis with visual tools, pattern detection, and actionable insights. Whether you’re debugging a Tomcat app or a custom microservice, it helps you cut through the noise and find the real problem.
By detecting thread starvation, lock contention, or misconfigured pools early, ThreadLogic can save hours of manual inspection — and potentially prevent downtime.
Recommended for:
- Java developers and architects
- SREs managing JVM-based platforms
- Teams troubleshooting scalability or latency issues
