
Why Capturing Memory Dumps in Azure App Service Is Best Done Through the Portal (Not procdump)
When an application slows down, crashes unexpectedly, or consumes more resources than it should, capturing a memory dump is one of the fastest ways to diagnose the root cause. Memory dumps allow engineers to inspect what’s happening inside the process—pinpointing leaks, runaway threads, and performance bottlenecks.
If you’re running on Azure App Service (PaaS), there are multiple ways to collect these dumps. Many developers are familiar with procdump, a trusted command-line tool for capturing snapshots of running processes. While procdump is powerful, it’s not the ideal way to capture memory dumps in App Service, especially in live production environments.
Here’s why we (and most Azure experts) rely on the Azure Portal’s built-in diagnostic tools instead.
The Problem with Relying on procdump
procdump works by attaching directly to the IIS worker process (w3wp.exe) and generating a dump when conditions like high CPU or memory are met. It’s a proven tool, but in a managed PaaS environment, it brings several challenges:
- Manual complexity: You must connect to Kudu or the underlying VM, locate the correct process ID, and run the command manually.
- Error-prone configuration: Different issues (memory leaks, CPU spikes, crashes) need different flags. A small mistake can result in an incomplete or useless dump.
- Scaling issues: In multi-instance apps, it’s hard to ensure you’re attaching to the instance actually experiencing the problem.
- Production risk: If misused,
procdumpcan increase CPU load or even destabilize a live app.
Why the Azure Portal Is the Smarter Way
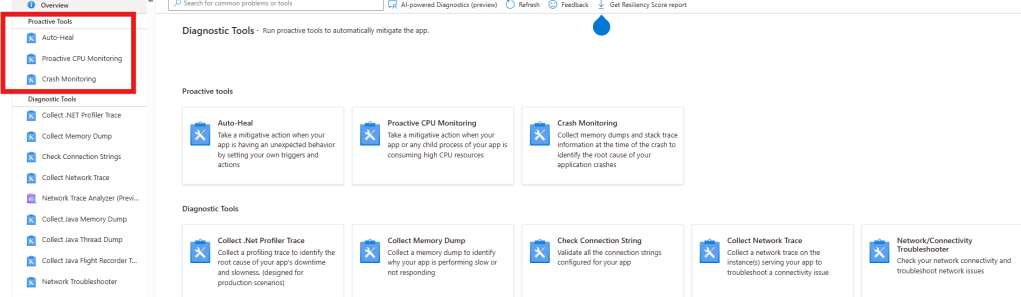
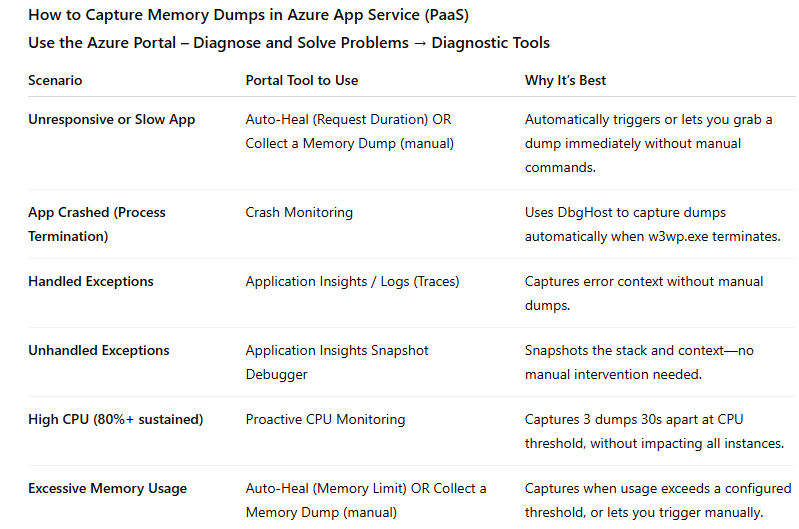
The Azure Portal offers integrated diagnostic features designed specifically for App Service. Tools like Auto-Heal, Proactive CPU Monitoring, Crash Monitoring, and “Collect a Memory Dump” simplify and streamline the process.
Here’s why it’s better:
- Faster response: Capture dumps in just a few clicks—critical during live incidents.
- Safer for production: These tools are optimized to minimize performance impact.
- No guesswork: The right
procdumporDbgHostsettings are applied automatically for each scenario (memory leak, CPU spike, crash, or slow response). - Instance targeting: Azure’s Diagnostics as a Service (DaaS) ensures we capture the dump from the correct instance in scaled-out environments.
- Centralized and secure: Dumps are stored in your Azure environment for immediate analysis—no manual transfers or external handling.
- Automation-ready: Auto-Heal and Proactive Monitoring can capture dumps automatically when thresholds are breached, often before end users notice a problem.
Real-World Impact
By using the Azure Portal, we’ve helped customers:
- Diagnose memory leaks in minutes without risky manual intervention.
- Capture crash diagnostics in multi-instance apps without guessing which VM was affected.
- Automate CPU and memory-based triggers to catch issues proactively, reducing downtime and customer impact.
For organizations running critical workloads on Azure App Service, using the Portal’s diagnostics isn’t just convenient—it’s a best practice for keeping applications stable and issues resolved faster.
The Bottom Line
While procdump remains a useful tool for on-premises or IaaS environments, the Azure Portal is the most efficient, safe, and reliable way to capture memory dumps on App Service. It eliminates complexity, reduces risk, and helps teams get to the root cause faster—so your users stay happy, and your business keeps moving.
If you want to streamline your incident response and strengthen your diagnostics strategy in Azure PaaS, start with the tools built into the platform. They’re designed to save time, reduce errors, and keep your apps running at their best.
