
Azure auto heal is a powerful tool that can be used to mitigate and capture vital information for any issues that may occur with your web applications. Every web app will eventually encounter some kind of issue, slowness, downtimes and the dreaded “intermittent issue”. With auto-heal you can mitigate the problem and even gather additional information to further troubleshoot any problem. In this post I’m going to show you how to configure custom auto-heal rules to capture a CLR profile if HTTP 502.3 errors are encountered.
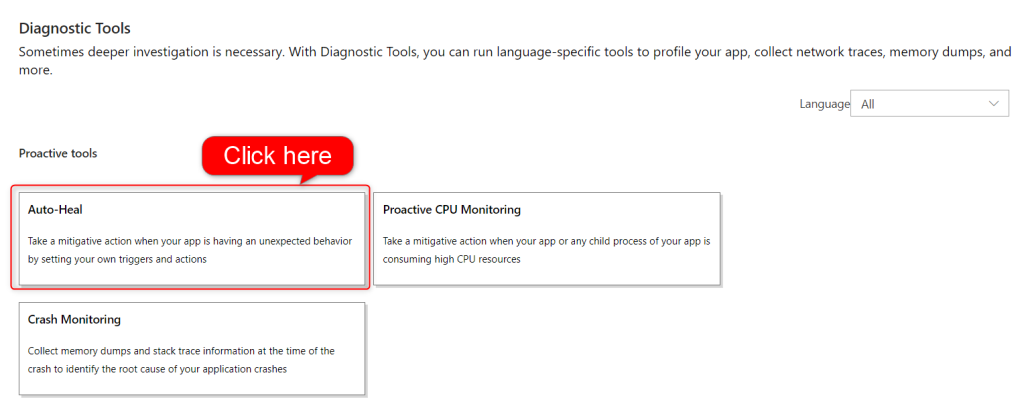
Select the Diagnostic Tools menu.

Select Auto-Heal
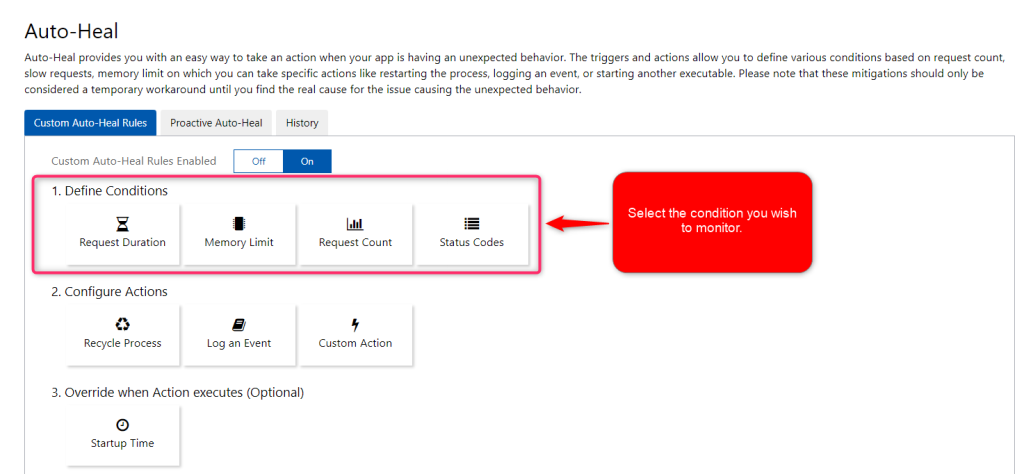
This is the main screen for Auto-heal configuration.
Select the tile that best matches the condition that you want to set for your mitigation rule. The conditions that are supported with Auto Heal Diagnostics are:
- Request Duration: examines slow requests
- Memory Limit: examines process memory in private bytes
- Request Count: examines number of requests
- Status Codes: examines number of requests and their HTTP status code
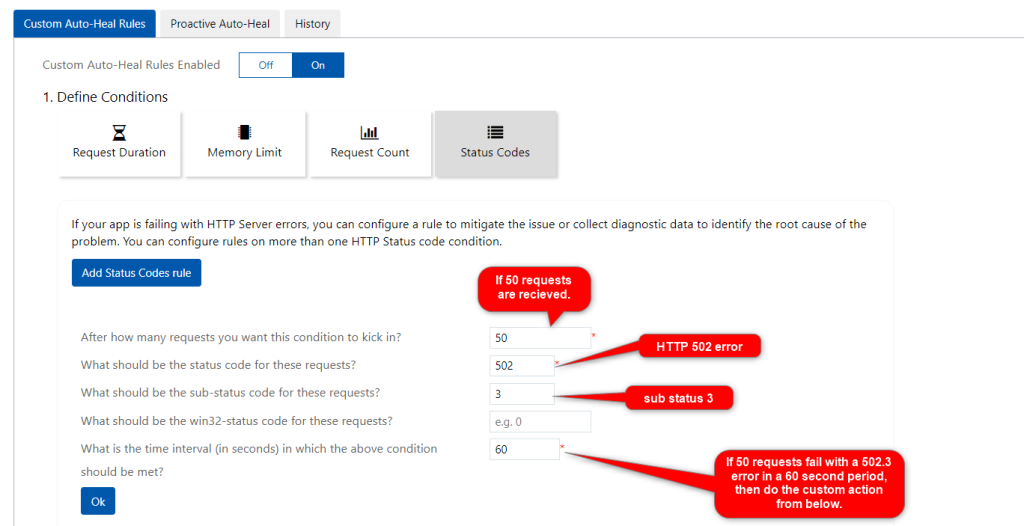
I’m setting this rule to look for a specific Status HTTP Code.

I’m setting the rule to check for HTTP requests that fail with a 502.3 in a 60 second period.

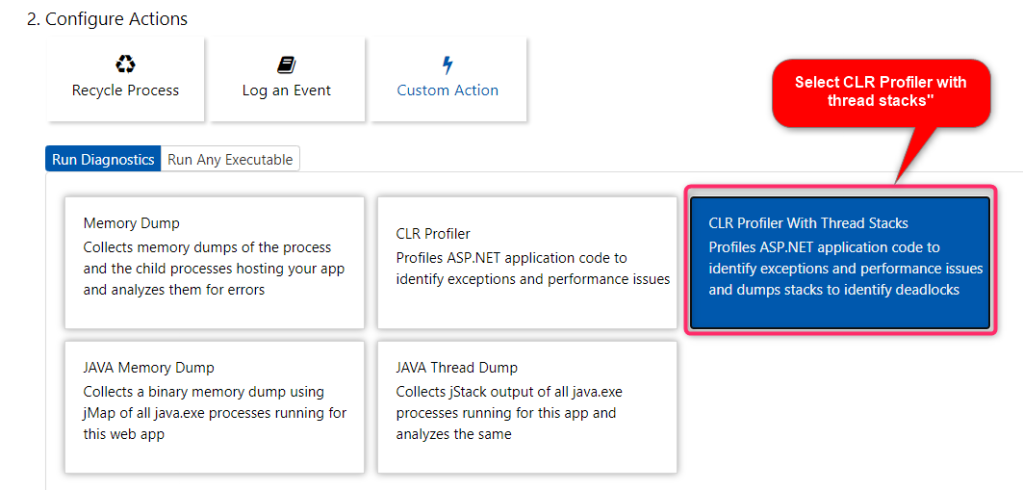
Select the tile that best matches the auto heal mitigation action that you want to perform under your mitigation rule conditions. When the graphic is blue, it means that action has been selected. (For custom actions, be sure to fill out the parameters required). The custom mitigation actions that are supported are:
- Recycle Process
- Log an Event
- Custom Action
- Run Diagnostics: runs
- Run Any Executable: runs specified executable

You can choose to take a memory dump, CLR profile, CLR profile with thread stacks, or if your using a JAVA stack, JAVA memory or thread dump. I’m selecting CLR profiler with thread stacks.
If you select “CollectKillAnalyze” please note that the web app will be restarted. I recommend that you select “CollectLogs” only.

Select Save.

Great info
LikeLiked by 1 person