
Pro-Active CPU monitoring is a powerful tool that can mitigate high CPU issues with your cloud applications without any involvement from administrators. You can configure CPU rules to temporarily mitigate a high CPU issue until the real cause for the unexpected issue is found. Additionally, Pro-Active CPU monitoring can also capture a dump file to identify the code responsible for the excessive CPU usage.
There are two ways to select diagnose and solve.
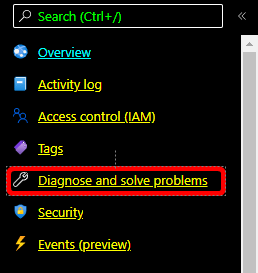
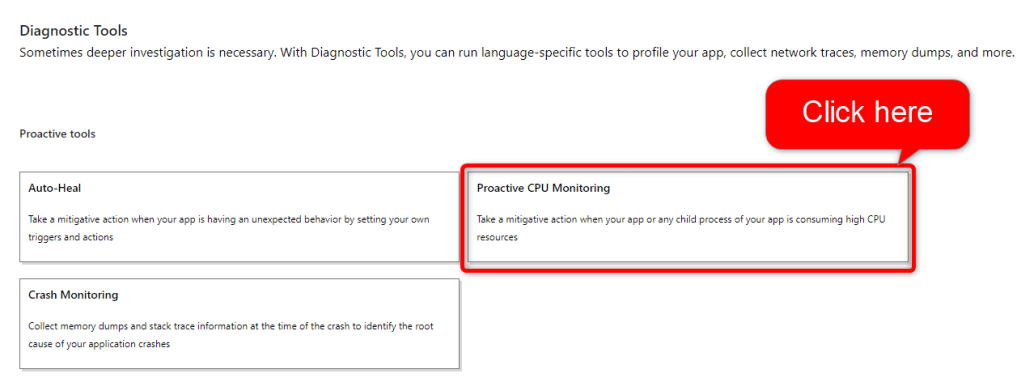
1. Browse to your App Service web app in Azure portal and click Diagnose and solve problems in the left navigation panel. Then, click on the homepage tile named Diagnostic Tools. Once you are inside Diagnostic Tools, click Proactive CPU Monitoring.
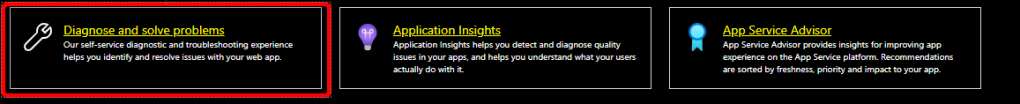
2. Alternatively, select the Diagnose and Solve blade from the middle of the screen. Then, click on the homepage tile named Diagnostic Tools. Once you are inside Diagnostic Tools, click Proactive CPU Monitoring.
Next you’ll need to configure it for your particular situation.
Configuring Conditions Parameters
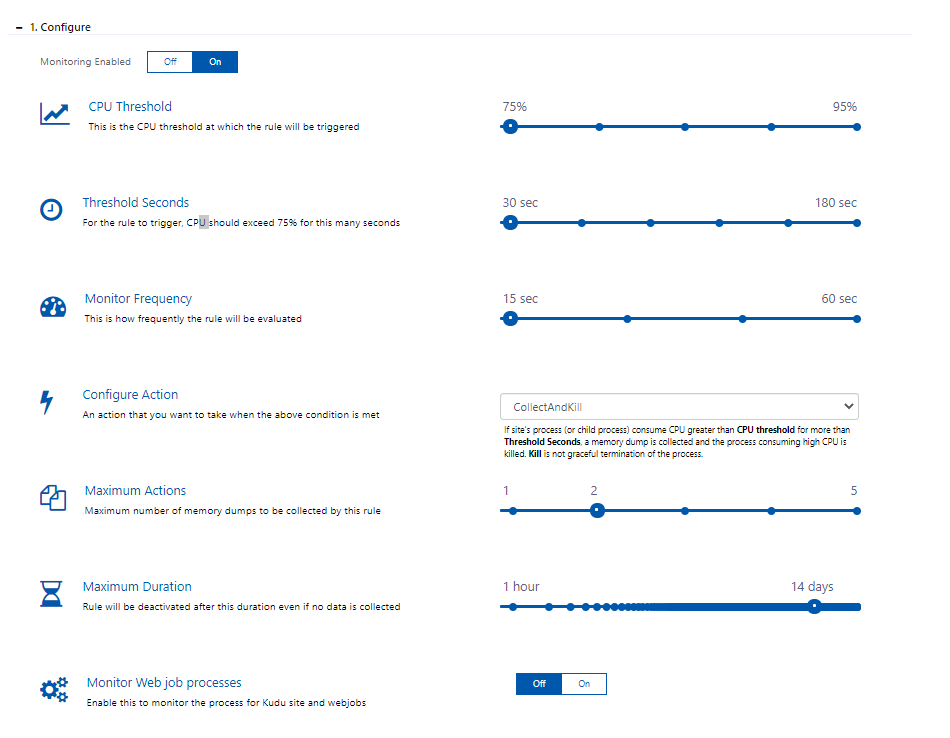
There are five conditions you can configure.
- CPU Threshold: the CPU threshold at which the rule will be triggered
- Threshold Seconds: the duration of the CPU exceeding the CPU threshold. The rule will be triggered at the end of the duration.
- Monitor Frequency: defines how often the condition will be evaluated
- Maximum Actions: the maximum number of memory dumps that the rule collects, ensuring no dumps are collected beyond the set amount
- Maximum Duration: the maximum duration of the rule until it becomes deactivated, 1 hour minimum to 14 days maximum.
Configuring Action Parameters
Once you have the conditions configured, you’ll need to define what action Azure will take.
Proactive CPU Monitoring offers 4 different modes listed below.
- Collect: In this mode, a memory dump is collected whenever any process consumes CPU greater than the CPU Threshold for longer than the allowed Threshold Seconds. (Monitor Duration should always be lower than Threshold Seconds) Memory dump is collected via
ProcDump.exe, and the number of dumps (or actions) are controlled by Maximum Actions. Once Maximum Duration is met, the rule becomes deactivated.When the memory dump is collected, the process is frozen until the dump generation completes. The time the process is frozen depends directly on the memory consumed by the process. The size of the dump generated is also directly proportional to the memory consumed by the process. - Kill: In this mode, the process is killed when the condition is met. The Maximum Actions is not honored and monitoring stops automatically after Maximum Duration. Kill is a forceful termination of the process and not a graceful exit. All requests that the current worker process is processing will be terminated, and end users may see 502 errors. If system terminates the child process, the error message may even be 500 or some form of application exception based on the stack.
- Collect and Kill: In this mode, a memory dump is collected and the process consuming high CPU is killed when the site’s process (or child process) consumes CPU greater than CPU threshold for more than Threshold Seconds. No analysis is performed but after the session finishes, you have an option to analyze the memory dump after the session ends by clicking the Analyze button.
- Collect, Kill, and Analyze: In this mode, a memory dump is collected and the process consuming high CPU is killed when a site’s process (or child process) consumes CPU greater than the CPU threshold for longer than the allowed Threshold Seconds. In addition, CPU dumps are analyzed by DumpAnalyzer tool, and an analysis report is generated. Analyzing a dump with this tool has some CPU impact on the instance and takes roughly 5-7 minutes at minimum to analyze one dump file. Analysis can take longer if the dump size is larger and depending upon what is captured in the dump.To prevent CPU overhead, only one dump is analyzed by the instance at a time. For example, if there are 10 instances and say the monitoring collected 5 dumps, all instances in parallel can analyze memory dumps. If there is 1 instance and 5 dumps are collected, the dump analysis will happen one after the other.
